
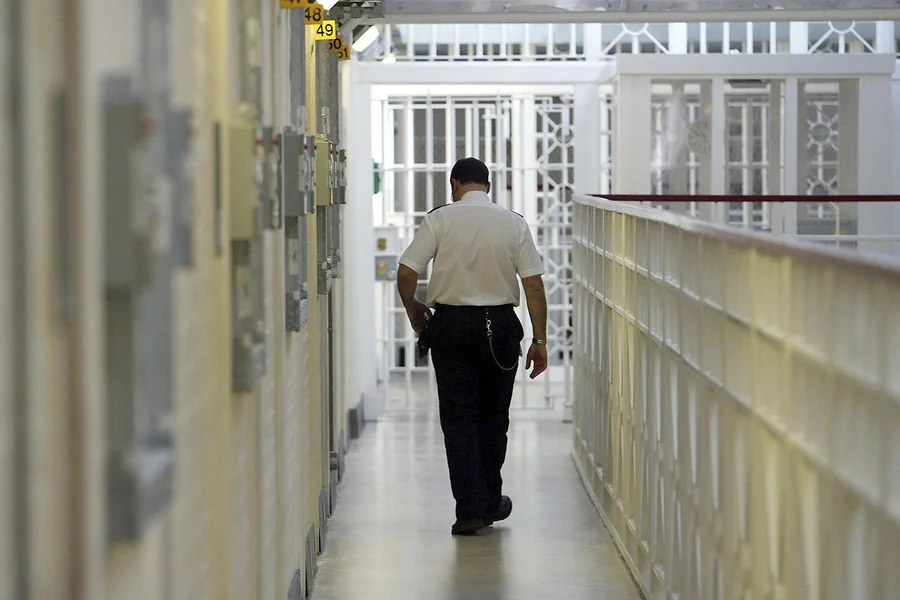
Inside America’s Prison Pipeline: New Data Shows How Policy, Disparity, and Recidivism Sustain a Growing System
A new analysis from Simmrin Law Group reveals a justice system shaped by decades of policy decisions that expanded incarceration while failing to reduce reoffending. The study traces how sentencing laws, demographic disparities, and limited rehabilitation programs have created a cycle that continues to return hundreds of thousands of people to prison each year. The findings offer a detailed look at the forces driving mass incarceration and the reforms that could help reverse it.
A Half‑Century of Growth in the U.S. Prison System
The United States has spent the past fifty years building the largest prison system in the world, driven by sentencing laws and enforcement strategies that dramatically increased the number of people behind bars. In 1972, the imprisonment rate stood at 93 per 100,000 people, but the population surged beginning in the early 1970s as states adopted tougher penalties and expanded prison capacity . Between 1985 and 1995 alone, the national prison population grew by 8 percent every year, with nearly every state experiencing increases during that period.
By 2009, the prison population had grown sevenfold, and the federal system had expanded by 53 percent over the same period . Although the population declined for more than a decade beginning in 2010, the trend reversed in 2022, marking the first increase in nearly ten years. Another rise followed in 2023, driven by growth across 39 states.
Recent Increases: Women and Youth Behind Bars
The study highlights two notable demographic shifts in recent years. First, the number of incarcerated women rose 4.1% between 2022 and 2023—more than double the rate for men . Second, the number of youths held in adult prisons increased by 50 percent in 2022, with the upward trend continuing into 2023. Female imprisonment grew 4.1% between 2022 and 2023, more than double the male rate, while 2022 saw a 50% increase in …. These changes raise concerns about the long‑term effects of adult incarceration on young people and the adequacy of gender‑responsive programming.
Today, nearly 2 million people are incarcerated across 1,664 state and federal facilities, and 450,000 individuals leave prison each year. With 95 percent of prisoners eventually reentering society, the system’s ability to support successful reentry has become a central policy issue .
Racial Disparities: A Persistent Structural Divide
The study underscores the deep racial inequities that continue to define the U.S. criminal justice system. One in five Black men born before 2001 will be incarcerated at some point in their lives, and people of color make up nearly 70 percent of the prison population . The disparities are stark when comparing population share to incarceration share:
| Group | Share of U.S. Population | Share of Prison Population | Share Serving 10+ Years |
|---|---|---|---|
| Black Americans | 14% | 33% | 46% |
| White Americans | 64% | ~30% | — |
The Era of Extreme Sentencing
Federal sentencing reforms in the 1980s reshaped the justice landscape by eliminating parole and imposing mandatory minimums. The Sentencing Reform Act of 1984 created federal sentencing guidelines and removed parole, while the Anti‑Drug Abuse Act of 1986 established mandatory minimums for drug offenses . As a result, the average federal drug sentence rose from under two years in 1986 to seven years by 2005.
The number of people serving life sentences also grew dramatically:
| Year | LWOP Sentences | LWP Sentences |
|---|---|---|
| 1992 | 9,000 | 58,000 |
| 2003 | Tripled | +62% |
| 2024 | 56,245 (6× 1992) | +68% |
Recidivism: The System’s Most Persistent Failure
The study identifies recidivism as one of the most pressing challenges facing the justice system. Sixty‑two percent of released prisoners are rearrested within three years, and 39 percent ultimately return to prison . Of the 450,000 people released in 2023, an estimated 280,000 will be rearrested by 2026, with 174,000 returning to prison.
A significant portion of these returns are not due to new crimes. In 2023, nearly 200,000 people were reincarcerated for probation or parole violations, including more than 110,000 for technical violations such as missed appointments or curfew violations. States spent $10 billion incarcerating people for supervision violations, with $3 billion tied to technical violations alone.
Why People Struggle After Release
The study outlines several overlapping barriers that make reentry difficult:
- Mental health: Disorders affect 15 percent of incarcerated men and 31 percent of incarcerated women—three to six times the civilian rate.
- Substance use: Half of all prisoners have a substance use disorder, and 70 percent of those with mental illness also struggle with addiction.
- Housing instability: Fifteen percent were homeless in the year before imprisonment.
- Education and employment: Forty percent lack a high school diploma, and employment barriers remain steep due to stigma and skill gaps.
- Family impact: 2.7 million children have an incarcerated parent, compounding the social cost of imprisonment.
State‑Level Recidivism: The Highest and Lowest Rates
The study compares three‑year reincarceration rates across states, revealing wide variation.
Highest Recidivism Rates (2024)
| State | Rate |
|---|---|
| Hawaii | 61.4% |
| Delaware | 55.9% |
| Alaska | 54.3% |
| Rhode Island | 50% |
| New Mexico | 49.1% |
| Tennessee | 47.2% |
| Arkansas | 46.1% |
| Utah | 46% |
| Vermont | 45.4% |
| California | 44.6% |
| Rank | State | Rate |
|---|---|---|
| 1 | Oregon | 13.1% |
| 2 | Virginia | 17.6% |
| 3 | South Carolina | 18.5% |
| 4 | Minnesota | 19% |
| 5 | New York | 19.1% |
| 6 | South Dakota | 20.2% |
| 7 | Texas | 20.3% |
| 8 | North Carolina | 21% |
| 9 | Florida | 21.2% |
| 10 | Washington | 22.1% |
California’s recidivism rate places it among the ten highest in the nation. The state’s admission data shows significant racial disparities. Compared to white residents, Black Californians are 5.6 times more likely to be admitted to prison, Hispanic residents 1.7 times more likely, American Indians 3.8 times more likely, and Pacific Islanders 1.6 times more likely. Asian Americans, by contrast, are 88 percent less likely to be admitted.
Parole violation readmissions also show uneven patterns, with Hispanic residents 11 percent less likely than white residents to be readmitted for parole violations.
Rehabilitation Models Showing Promise
The study highlights several programs that may help reduce recidivism by addressing root causes rather than relying on punitive approaches. One of the most notable is the Restoring Promise initiative, which focuses on young adults in correctional facilities. The model emphasizes dignity, mentorship, and community, and has been adopted in six states.
Survey results from participating units show strong outcomes:
| Metric | Positive Response |
|---|---|
| Felt safe | 94.6% |
| Productive time | 92.5% |
| Received support | 88% |
| Gained life skills | 88.9% |
| Officers treated them with respect | 68% |
| Officers as role models | 71% |
| High‑quality visits | 83.7% |
Other programs, such as Michigan’s Vocational Village and The Last Mile, show strong employment outcomes for participants, suggesting that skill‑building may be a critical component of reducing reoffending.
The Road Ahead
The data makes clear that the United States faces a recidivism crisis intertwined with mental health challenges, economic barriers, and longstanding racial inequities. Without intervention, roughly 320,000 of the 450,000 people released from prison in 2022 will be rearrested by 2027, with 180,000 returning to prison . Evidence‑based programs that emphasize rehabilitation, education, and stability offer a promising alternative.
Simmrin Law Group’s study suggests that meaningful change is possible if states scale the programs that have already shown success. The question now is whether policymakers will act quickly enough to meet the scope of the crisis.